

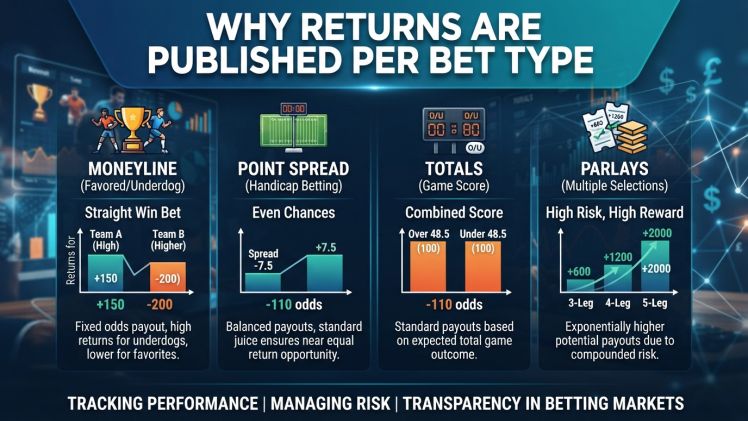
A single return percentage describes a slot adequately because there is only one way to play it. Games offering multiple bet types cannot be summarized that way, because each wager carries its own mathematics and the figures can differ substantially. Visiting a Crazy Time website information page or any modular show’s rules reveals a table rather than a number, and reading it properly changes which bets look attractive.
Why One Number Would Mislead
In a segmented wheel show, betting on a frequent low-value segment and betting on a rare bonus are mathematically different propositions with different house edges. An average across them would describe a player who spreads stakes evenly, which almost nobody does. Regulators in several jurisdictions therefore require per-bet disclosure specifically, on the reasoning that a figure describing a hypothetical player is not disclosure at all.
How Much the Figures Actually Differ
The spread is wider than most players expect.
Frequent Bets Versus Rare Ones
Published tables for modular shows commonly display returns varying by a percentage point or more across bet types, with the highest figures on simple frequent outcomes and lower figures on the spectacular rare ones. The pattern is consistent across the industry and economically logical: rare high-payout bets carry more marketing value, so they are priced less generously. A player concentrating on bonus segments is accepting a measurably worse price than one betting on number segments.
What the Table Tells You
A per-bet return table supports several practical reads:
- Which bets carry the thinnest margin, usually the simplest ones
- How much the spectacular outcomes cost relative to ordinary ones
- Whether side bets are priced competitively or as premium entertainment
- How multiplier mechanics shift the figures on affected bet types
- Whether a mixed strategy’s blended return differs from what you assumed
The blended-return calculation is the one worth doing: weight each bet type’s return by the share of stake you actually place on it, and the result is your personal expected return rather than the game’s headline.
Where Else This Pattern Appears
Per-bet disclosure is not limited to wheel shows. Roulette variants publish different figures for even-money and straight-number bets where local rules apply, card games list main and side bet returns separately, and some slots state differing figures across bet levels. Whenever a game offers more than one way to stake, a single number is almost certainly an average concealing a spread.
Two Minutes Well Spent
Finding the table takes one tap into game information. Reading it reveals that bets differ in price, often substantially, and that the most exciting wagers are usually the most expensive. That is neither hidden nor scandalous, it is simply published in a place almost nobody looks, which makes it the most reliably underused information in the entire catalog.

We are an AI-powered SEO and content writing platform dedicated to helping websites rank higher, grow organic traffic, and look their best. Our mission is to make SEO and web design simple, effective, and accessible for everyone. Let’s achieve more together.